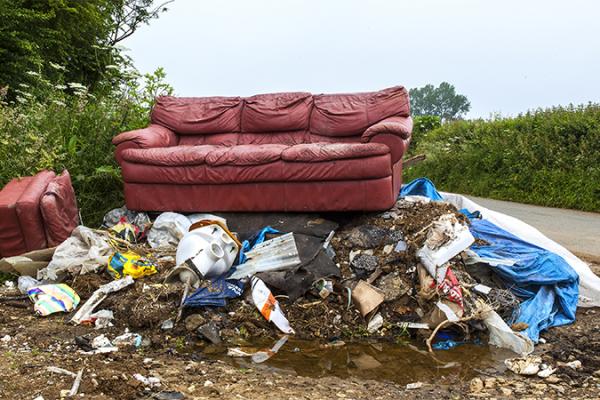
GMB call on government to take more action on fly-tipping following 75,447 incidents in East of England

GMB call on government and local authorities for more action on fly tipping as Parliament debates the 75,447 incidents in East of England in 2016/17 costing £4,339,536 to clear
We need a policy of zero tolerance with action against fly tipping on all fronts at all times, says GMB London
GMB, the union for workers in the refuse and recycling sector, have called on the government and local authorities to take more action on fly tipping. In 2016-2017 in East of England there were 75,447 incidents of fly-tipping. This accumulated a total clearing cost of £4,339,536. In England as a whole, there was 1,002,154 fly-tipping incidents between 2016-2017. The total cost of clearing these incidents was £57,667,483.
The issue was debated in Parliament on 17 April, led by Environment, Food and Rural Affairs Committee Chair Neil Parish MP, who has spoken of fly-tippings “potential to be dangerous to our health and is detrimental to the environment.” [See notes to editors for transcript of fly-tipping debate]
In East of England, Peterborough was the council with the most fly-tipping incidents, with 8,186. The council accumulated clearing costs of £461,285. Other councils with high amounts of fly-tipping incidents between 2016-2017 also include; Great Yarmouth with 7,993 incidents, costing £470,443; Norwich with 5,264 incidents, costing £272,586; Luton with 4,946 incidents, costing £338,896; Stevenage with 4,287 incidents, costing £193,153; Bedford with 2,906 incidents, costing £150,435; Welwyn Hatfield with 2,664 incidents, costing £195,724; and Harlow with 2,614 incidents, costing £156,781.
The figures for the 47 East of England councils are set out in the table below. This is from a new study by GMB London Region of official data from the Office of National Statistics (ONS) for 47 councils in East of England. It shows the number of fly-tipping incidents in each council, followed by the cost of clearing them. [See notes to editors for sources, definitions and qualifications]
Fly-tipping incidents reported by local authorities in England 2016-17
|
Total Incidents |
Total Incidents Clearance Costs (£) |
|
|
*Total England |
1,002,154 |
57,667,483 |
|
East |
75,447 |
4,339,536 |
|
Babergh |
289 |
10,238 |
|
Basildon |
5,762 |
316,481 |
|
Bedford |
2,906 |
150,435 |
|
Braintree |
724 |
44,606 |
|
Breckland |
1,060 |
60,631 |
|
Brentwood |
558 |
45,899 |
|
Broadland |
436 |
21,277 |
|
Broxbourne |
754 |
35,628 |
|
Cambridge |
1,889 |
144,014 |
|
Castle Point |
910 |
87,746 |
|
Central Bedfordshire |
1,153 |
86,666 |
|
Chelmsford |
503 |
50,786 |
|
Colchester |
1,591 |
95,540 |
|
Dacorum |
1,261 |
77,848 |
|
East Cambridgeshire |
214 |
10,030 |
|
East Hertfordshire |
1,114 |
64,965 |
|
Epping Forest |
2,384 |
158,497 |
|
Fenland |
1,428 |
56,928 |
|
Forest Heath |
264 |
11,898 |
|
Great Yarmouth |
7,993 |
470,443 |
|
Harlow |
2,614 |
156,781 |
|
Hertsmere |
800 |
35,540 |
|
Huntingdonshire |
692 |
39,387 |
|
Ipswich |
579 |
21,919 |
|
King's Lynn and West Norfolk |
1,980 |
58,348 |
|
Luton |
4,946 |
338,896 |
|
Maldon |
309 |
22,276 |
|
Mid Suffolk |
324 |
14,137 |
|
North Hertfordshire |
925 |
42,999 |
|
North Norfolk |
495 |
38,846 |
|
Norwich |
5,264 |
272,586 |
|
Peterborough |
8,186 |
461,285 |
|
Rochford |
688 |
41,663 |
|
South Cambridgeshire |
211 |
8,762 |
|
South Norfolk |
680 |
36,744 |
|
Southend-on-Sea |
405 |
19,782 |
|
St Albans |
1,324 |
61,284 |
|
St Edmundsbury |
334 |
18,412 |
|
Stevenage |
4,287 |
193,153 |
|
Suffolk Coastal |
223 |
13,120 |
|
Tendring |
1,132 |
60,213 |
|
Three Rivers |
714 |
65,310 |
|
Thurrock |
: |
: |
|
Uttlesford |
193 |
11,593 |
|
Watford |
1,414 |
63,142 |
|
Waveney |
871 |
47,078 |
|
Welwyn Hatfield |
2,664 |
195,724 |
Warren Kenny, GMB Regional Secretary said:
“Government and local councils have to be more proactive in dealing with fly tipping as new figures show that in England in 2016/17 there were over a million incidents and cost £57,667,483 to clear.
“There needs to be better education on the costs of dealing with the problem and how people can dispose of rubbish and unwanted items properly.
“Councils must invest in easy to access recycling and disposal facilities for residents to use and offer accessible collection schemes for bulk items.
“Finally, councils have to firmly clamp down on fly tipping by larger fines, investment in surveillance equipment and rigorous investigation of incidents and follow up action. Some councils have a poor record on this which encourages an attitude of impunity.
“We need a policy of zero tolerance with action against fly tipping on all fronts at all times.”
ENDS
Contact: Dave Powell 07710 631 349 or Vaughan West 07967 342197 or GMB London Press Office 07970 114 762
Notes to Editors
1] House of Commons debate on fly-tipping (17 April 2018)
2] Key points
For the 2016/17 year, local authorities in England dealt with around 1 million (1,002,000) fly-tipping incidents, a 7% increase from the previous year.
Two thirds (67%) of fly-tips involved household waste. Total incidents involving household waste increased by 8% from 2015/16.
Consistent with previous years, the most common place for fly-tipping to occur was on highways, which accounted for almost half (49%) of total incidents in 2016/17. The number of highway incidents has increased by 4% from 2015/16.
As in the last few years, the most common size category for fly-tipping incidents in 2016/17 was equivalent to a ‘small van load’ (33% of total incidents), followed by the equivalent of a ‘car boot’ (27%).
The estimated cost of clearance for fly-tipping to local authorities in England in 2016/17 was £57.7 million.
Local authorities carried out 474,000 enforcement actions in 2016/17, costing around £16 million, a decrease of 20,000 actions and £0.9 million in cost from 2015/16.
The number of fixed penalty notices issued increased by 56% to 56,000 in 2016/17. This is now the second most common enforcement action (after investigations), and accounted for 12% of all enforcement actions in 2016/17.
These statistics are based on fly-tipping incidents reported by local authorities in England, and exclude the majority of private-land incidents. Local authorities gather their data from a number of different sources, and data can often be collected and reported by separate teams, which may lead to discrepancies and some uncertainty. Improvements in data collection and reporting over time mean that trends should be interpreted with caution.
3] Source: Defra, WasteDataFlow


